Randolph students use heat mapping data to address climate risks
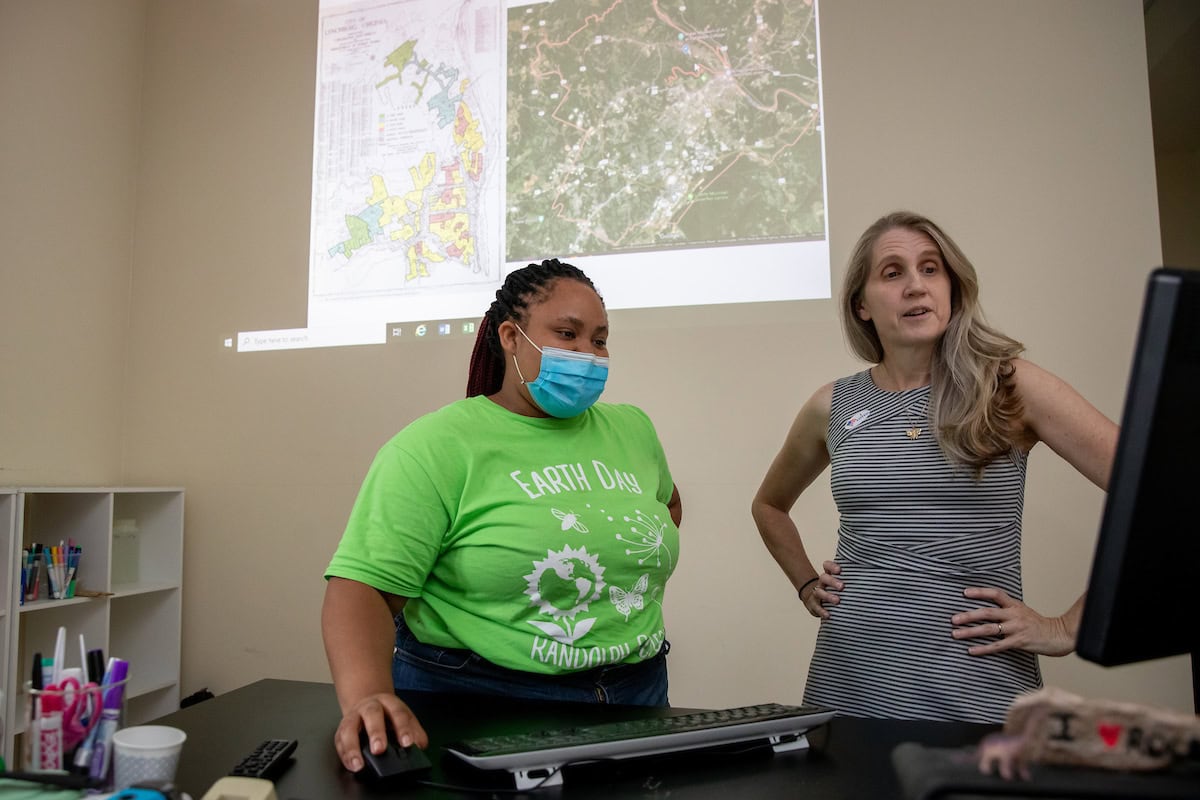
Shae Starks ’22 and professor Karin Warren worked on a summer research project looking at how heat affects communities differently.
The results from Randolph College’s participation in an urban heat mapping campaign are in, and now it’s time to put the data to use.
Earlier this year, Virginia Heat Watch brought together 12 schools from the Virginia Foundation for Independent Colleges to map and analyze where residents are most at-risk during heat waves.
Participants in communities across the state walked, biked, or drove designated routes on the same July day, using thermal sensors to record temperature and humidity.
In Lynchburg, where a Randolph professor headed up the project, the data showed distinct hot zones, where some parts of the city were 8 to 10 degrees warmer than others on a hot day.
These differences were expected, said Karin Warren, Randolph’s Herzog Family Professor of Environmental Studies and Science, who led efforts in the area with Shae Starks ’22.
Heat tends to vary depending on factors including the amount of tree cover and green space in an area, how much of it is covered by pavement and buildings, its proximity to water, and other variables.
In urban areas, heat comes from sun exposure and climate conditions, along with other sources like automobile use and industrial production, and is then retained in hard, impermeable surfaces—think roads, parking lots, and buildings.
Teams in communities including Virginia Beach, Richmond, and Salem saw similar results, Warren said.
Some of the hottest parts of the city are areas that were historically redlined—a discriminatory practice that denied services to residents of certain areas based on their race or ethnicity.
Social and environmental justice is just one of the areas in which the Heat Watch data can now be used, along with health-related climate action projects, community and government initiatives, and development planning.
The project is part of a growing effort to recognize the dangers of climate change and the health risks of heat. In September, the Occupational Safety and Health Administration announced it would be drafting its first rule governing heat exposure at work, in addition to forming a Heat Illness Prevention Work Group.
Locally, Warren and a group of Randolph students have been looking at the data and working with the city and colleagues at Sweet Briar College, led by environmental studies professor Lisa Powell, and the University of Lynchburg, led by environmental studies and sustainability professor Laura Henry-Stone.
Their goal is to develop equitable, community-based strategies to address the identified heat risks.
At Randolph, a student team including Eva Pontius ’23 and Olivia Richards ’23 is currently researching options for addressing both heat risk and food security in vulnerable areas of the city through the development of urban food forests.
A PDF of the full report, with heat maps, can be found at https://osf.io/7mj64/?pid=3xvmg. Lynchburg’s data is also available on a website students started this fall: https://sites.google.com/randolphcollege.edu/lynchburgclimateresilience/heat-maps.
Tags: conservation, environmental justice, environmental science, environmental studies, Heat Watch, Virginia Heat Watch