Students take the driver’s seat with Summer Research
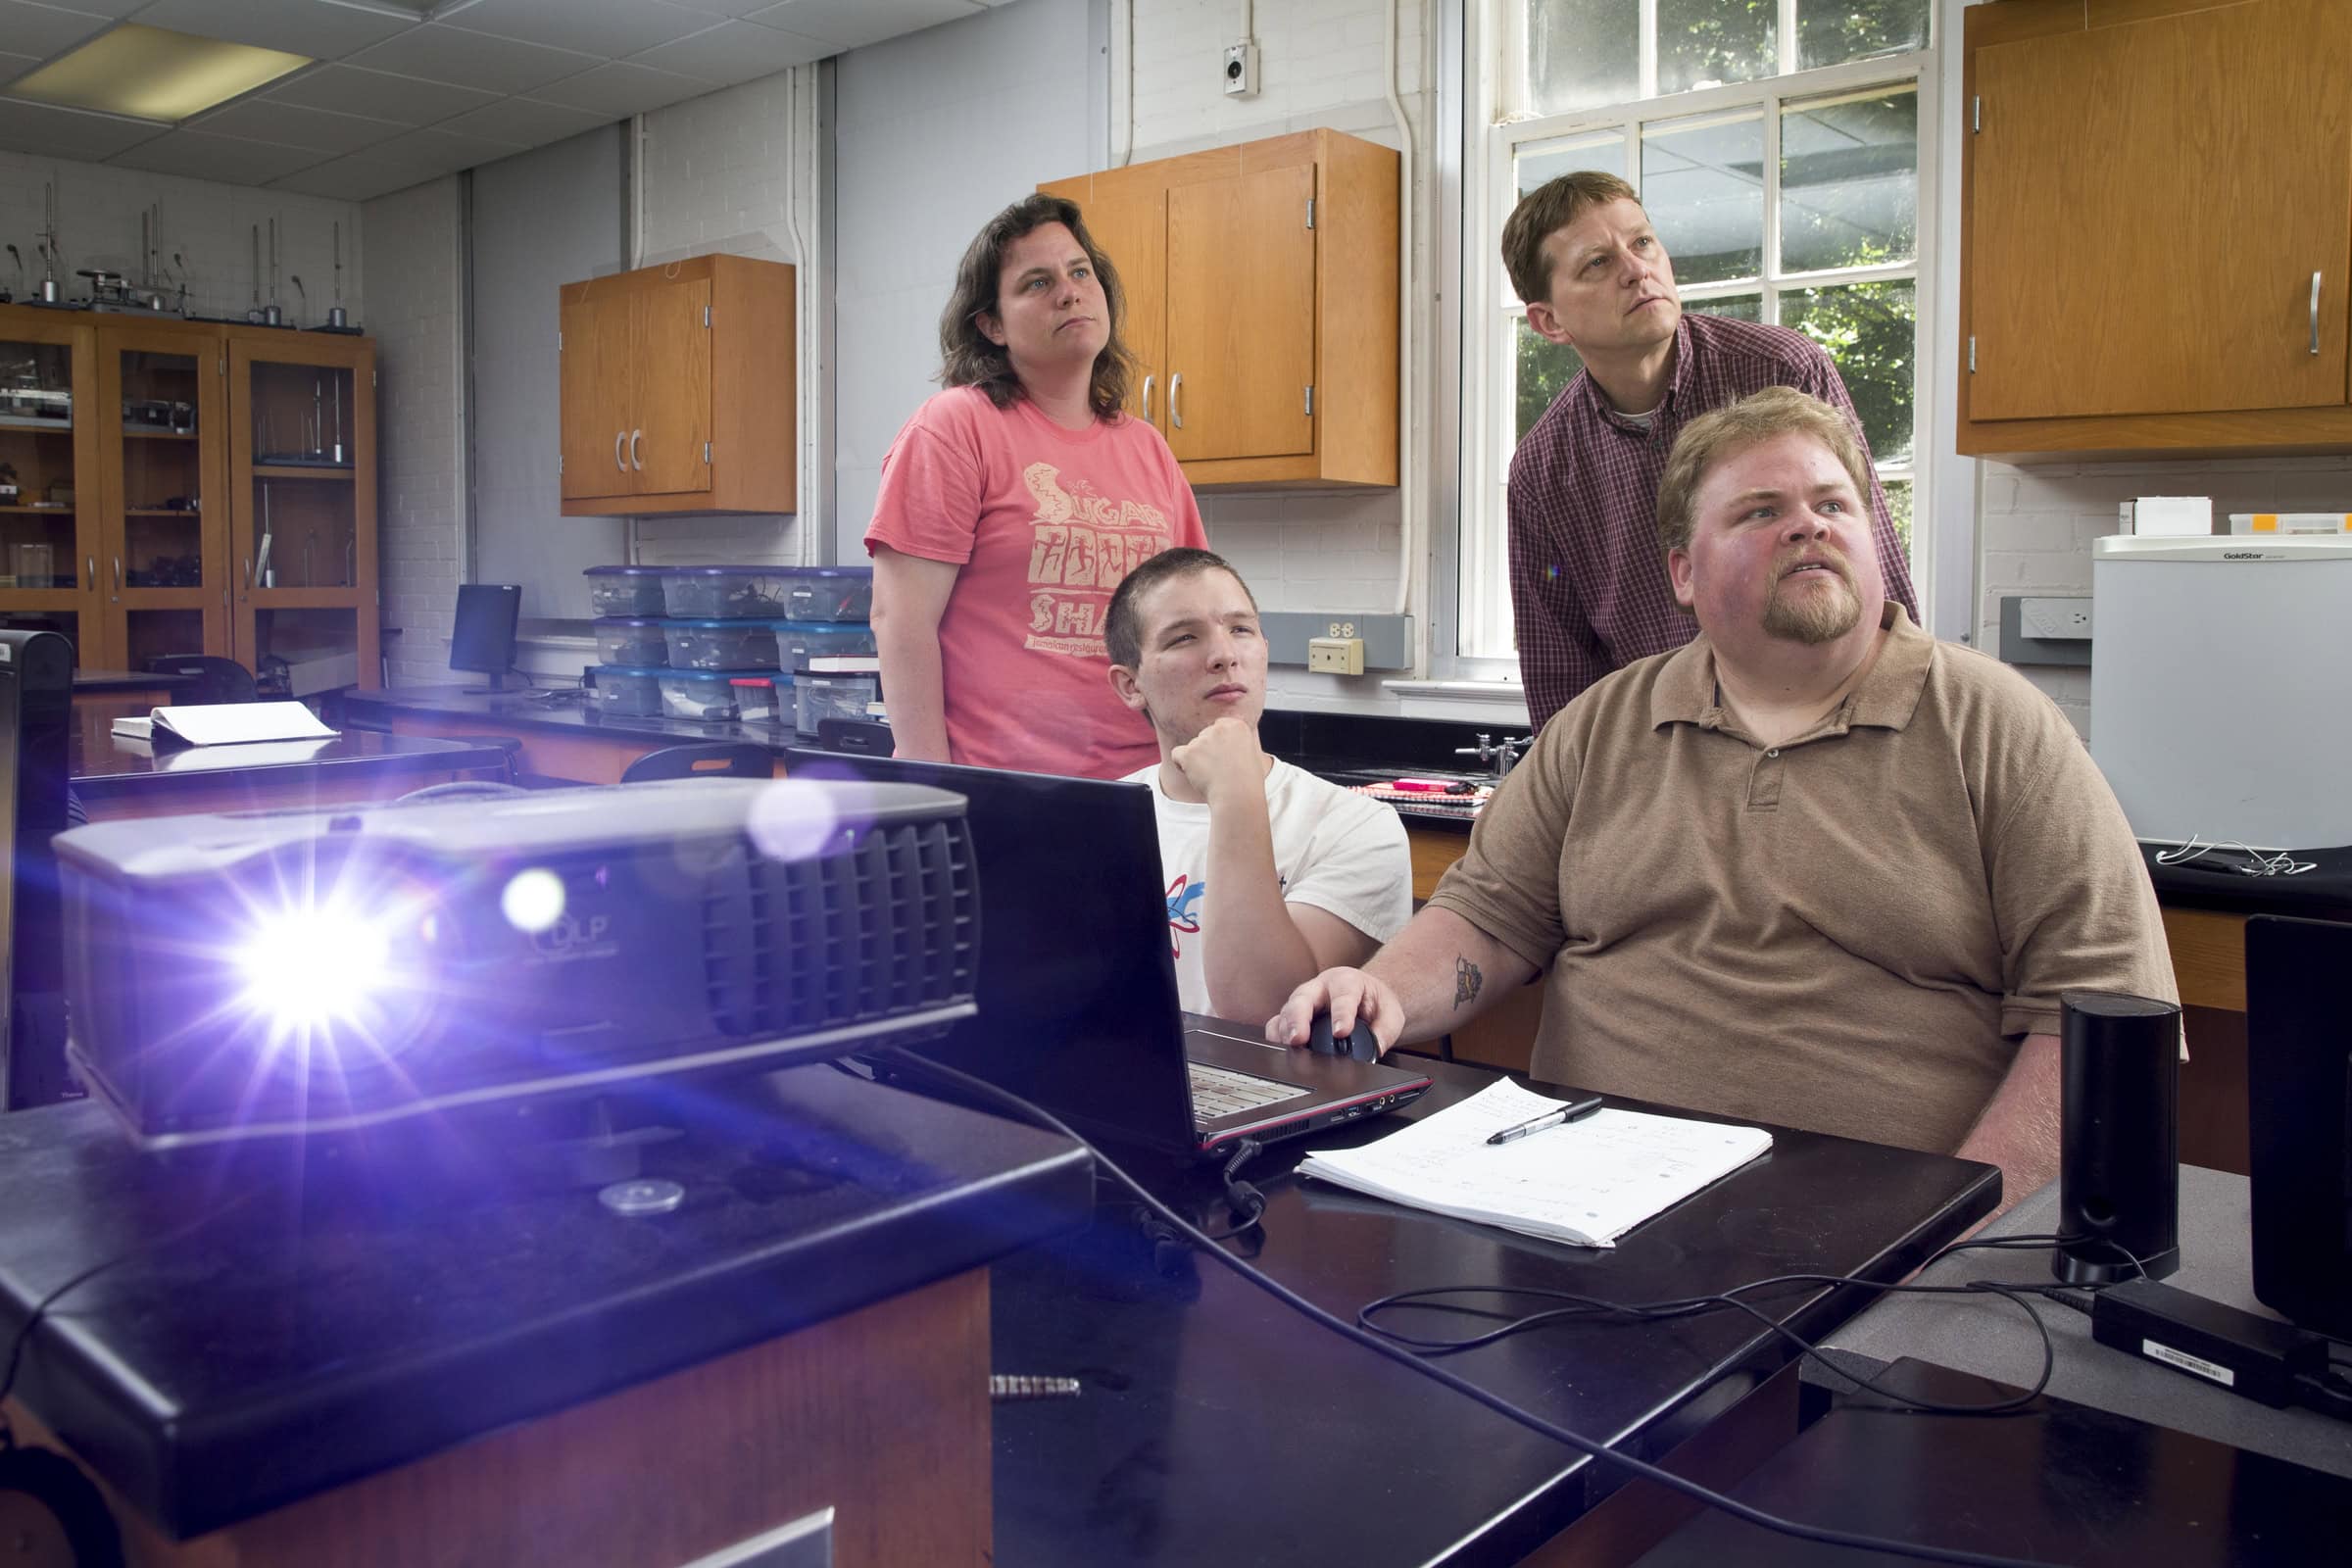
Zach Vernon ’18 (left) and Russ Burt ’16 analyze graphs of car accident statistics with physics professors Peter Sheldon and Sarah Sojka.
For many years, it’s been widely believed that a vehicle’s back seat is the safest place in the event of a crash, but Russ Burt ’16 and Zach Vernon ’18 aren’t completely convinced. Instead, they, along with physics professors Peter Sheldon and Sarah Sojka, are focusing their Summer Research project on determining if there is any truth in that logic.
The team is acquiring accident statistics from the National Automotive Sampling System (NASS) and organizing that data in a Statistical Analysis System (SAS). The big data analysis includes about 55,000 samples of real accidents, with pictures and diagrams in each accident report.
For each sample, Burt and Vernon are looking at 110 variables, including seatbelt use, direction of the vehicle, and where the most damage occurred. “They have a crazy amount of details about all these accidents,” said Sojka.
Though their project already seems complex enough, one of their biggest challenges has been learning how to navigate the SAS software. “So far we’ve found that SAS, although not incredibly difficult to work with, takes time,” Burt said.
The accidents they are researching took place between 1997 and 2013. One of the most complicated parts of the project so far, Vernon said, was merging all of those accident statistics into the program in one format. They’ve also had to filter through the thousands of accidents to only sample those which involved at least one rear seat passenger.
“That was a little tedious,” said Vernon.
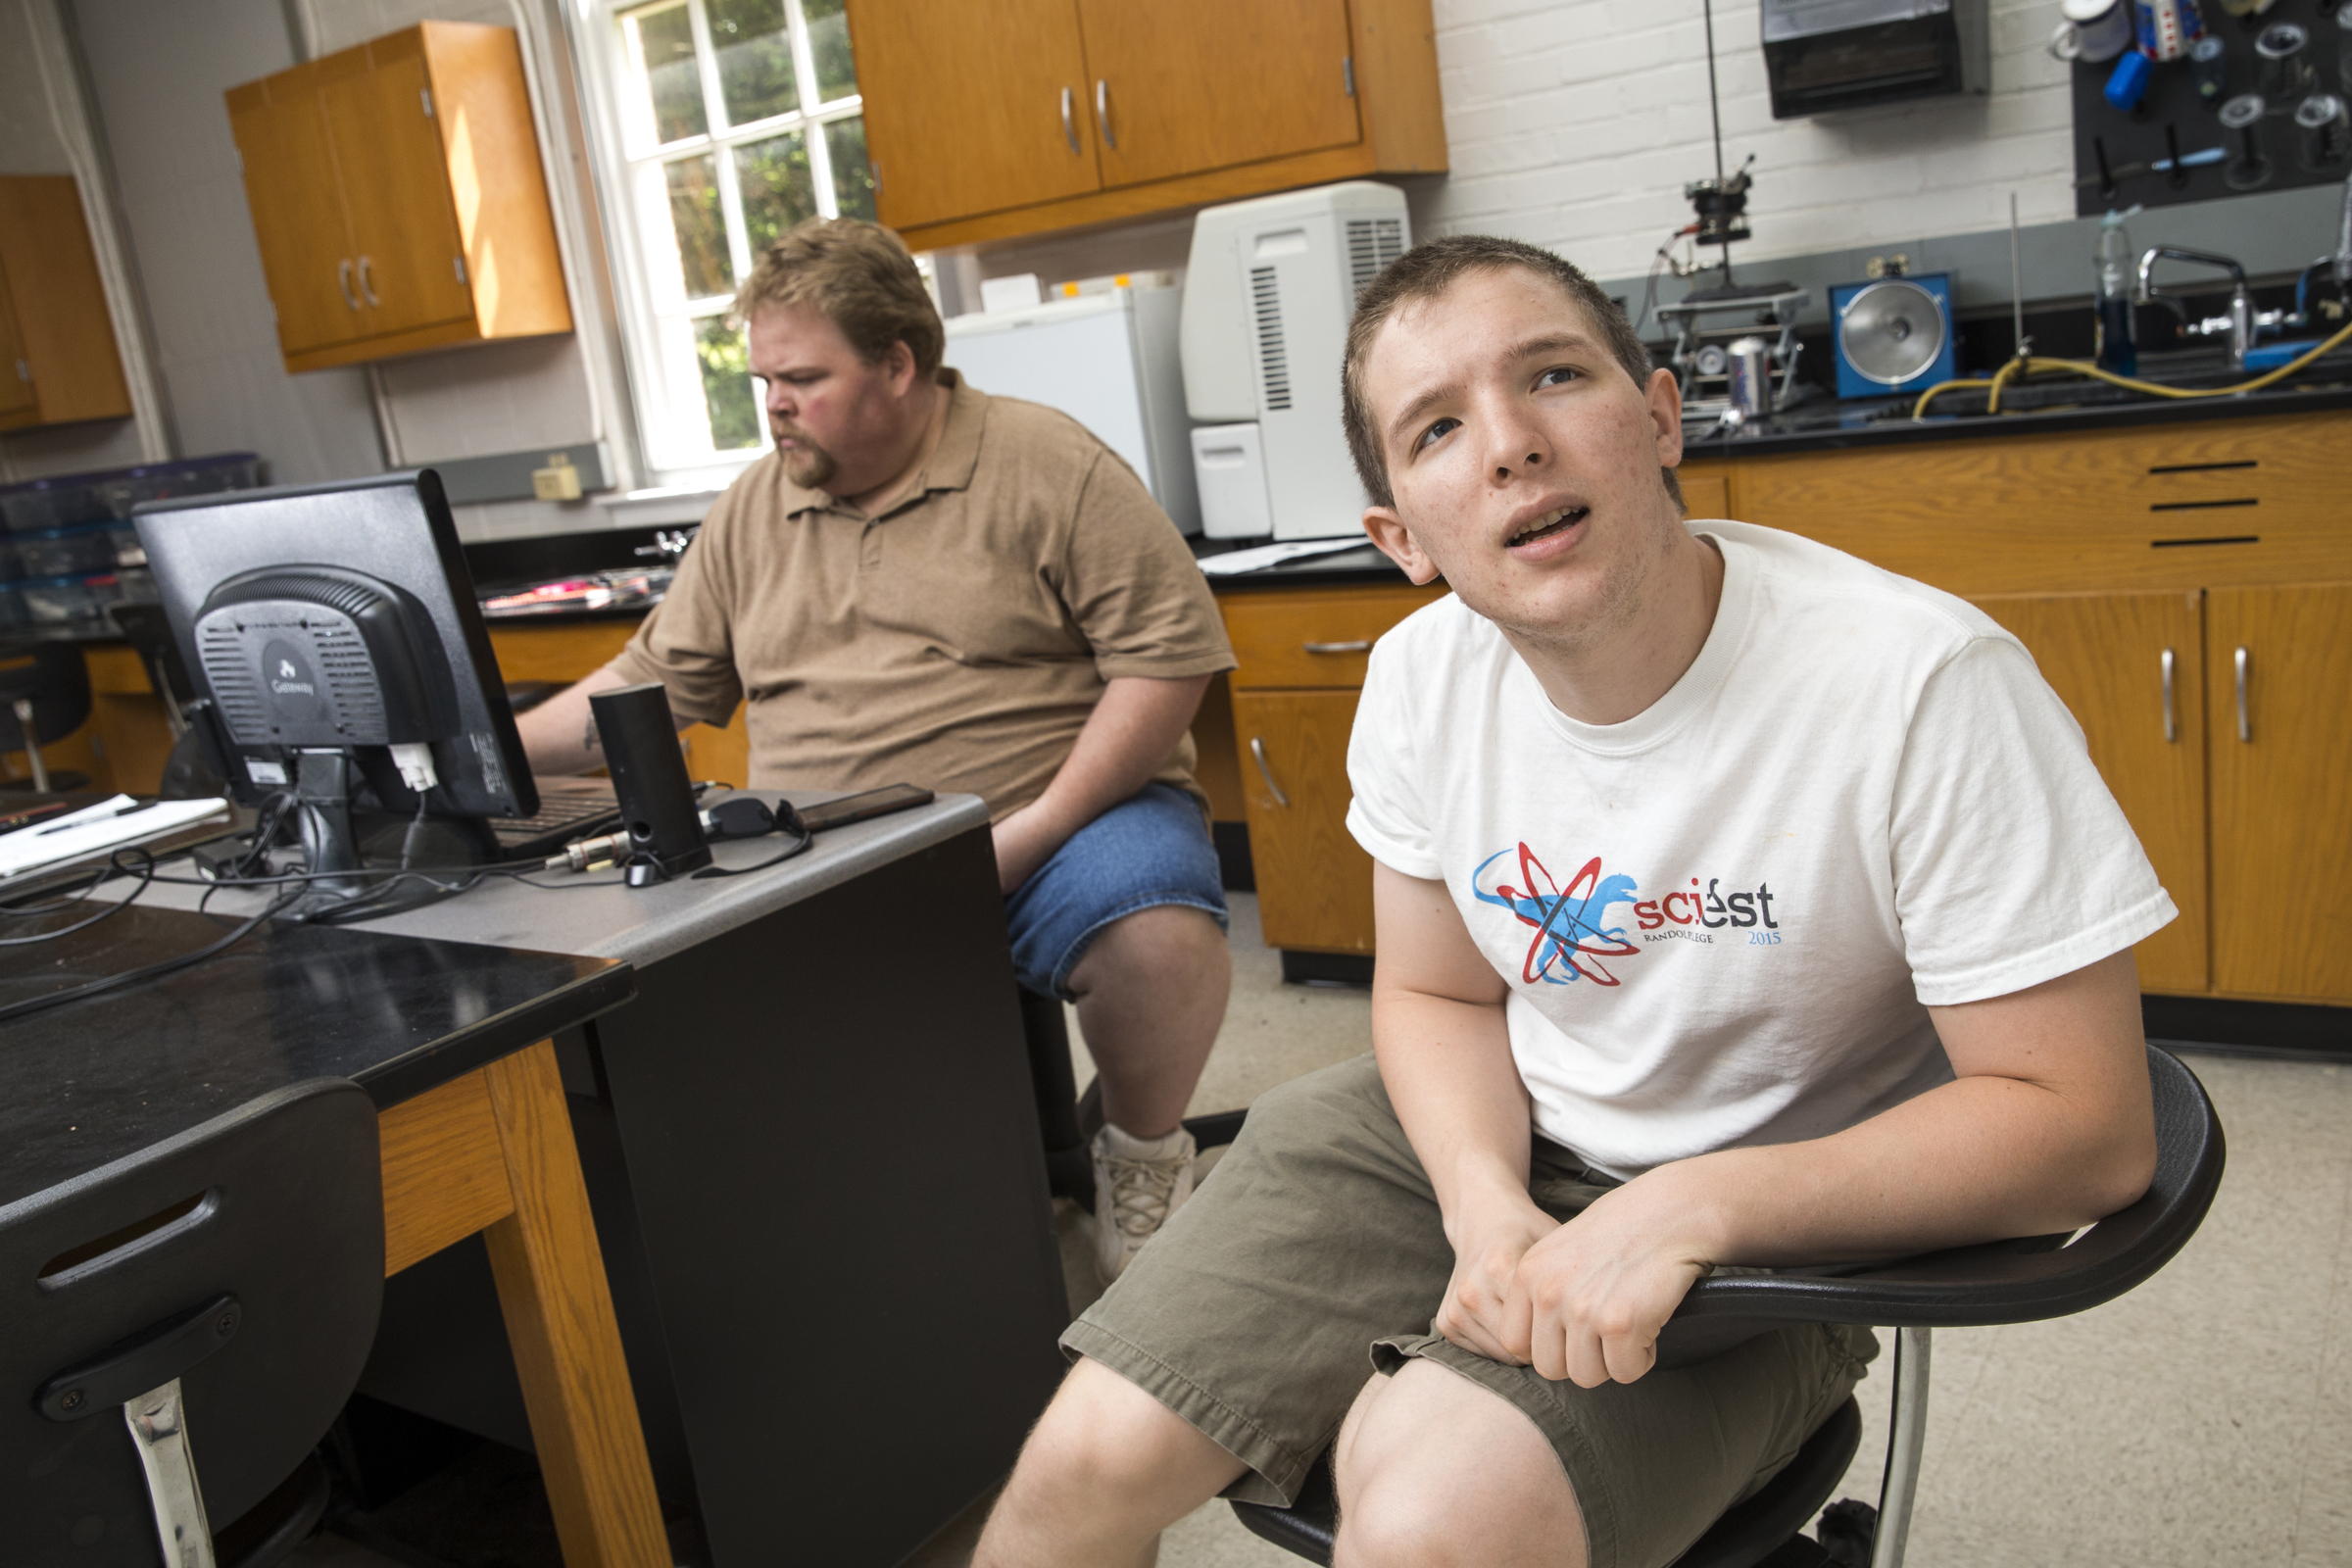
Zach Vernon ’18 (right) and Russ Burt ’16 analyze graphs of car accident statistics.
They are now binning (grouping) the data and breaking it down into graphs, which allows them to categorize accidents and compare variables like high speeds and severity of injuries. “Before we started binning them, we were getting graphs that could be considered abstract art or pie charts that looked like records,” joked Vernon.
Burt has noticed that in recent years, dealerships and automotive companies’ attention to safety has almost completely shifted to the front seats of their vehicles.
“Every year we see changes to airbags in the front seats, but there’s never a change to the rear seats,” he said. “What we’re seeing in our research is that even the published data doesn’t show rear seat statistics.”
“What little published information we found was from the late ’80s and early ’90s, and it was mostly discussing seatbelts and their impact on safety in the rear seat,” added Vernon.
Sojka said crash testing has also shifted focus to the driver’s seat and the importance of seatbelt use. Anecdotally, adults are less likely to wear seatbelts in the back seat, she said.
“It was always assumed in studies from the ’80s that the back seat was safer,” she said. “But now, we’ve added in all these airbags and things like that, and we are wondering if that trend is sort of switching.”
Vernon and Burt said preliminary statistics before they started binning data suggested their hypothesis is true. “It seems that there may be a pattern arising that the rear seat is not as safe as we have been led to believe,” said Burt.
According to preliminary data, there has been a correlation between age and seat position. Vernon said their statistics have shown children under the age of 17 sitting in the rear middle seat were more likely to be severely injured in accidents than those over 18.
Burt and Vernon are also studying a statistical category of “unknown” seats, which includes vehicles with more than two rows of seats as well as passengers in pickup beds and trunk spaces. Burt pointed out that there were 992 fatalities that fit that category between 1997 and 2013.
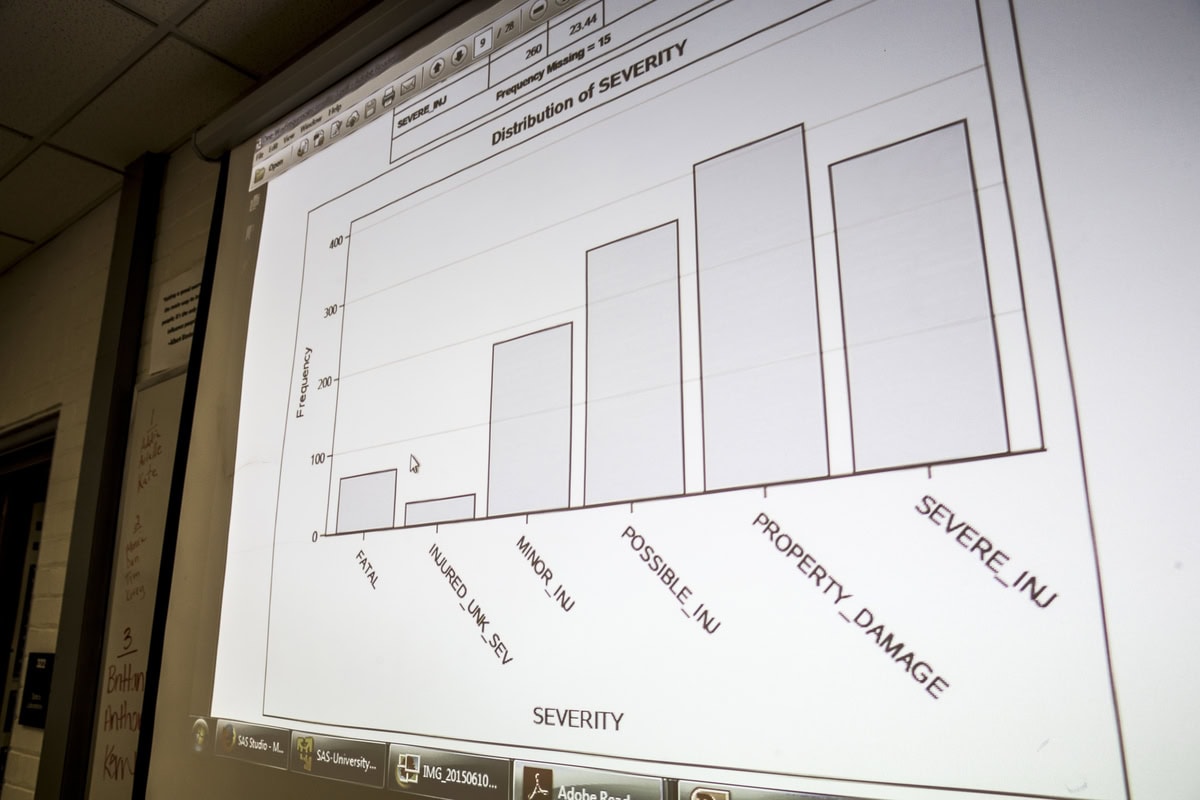
Charts show the relationship between different variables in car accidents.
Burt’s previous jobs inspired him to choose this Summer Research project. Before coming to Randolph, he drove a tow truck and a school bus, and was an EMT for a time. He also spends a lot of time chauffeuring his six children, who have to sit in the back seats of any vehicle he drives.
Vernon said he took on the project for the experience and for the opportunity to use his physics and engineering skills to work with big data. The students hope to publish their results, and, depending on what they find, continue their research with a focus on how to improve backseat safety in the future.
“We’re at a really good point right now, especially for two guys who hadn’t used SAS before,” Burt said. “We’ve struggled and beat our heads against keyboards, but we’ve learned a lot.”
“Being able to teach yourself how to use new programs is such a valuable skill, and I don’t see any big bruises on their heads or anything,” added Sojka with a laugh.
Tags: engineering, Peter Sheldon, physics, Russ Burt, Sarah Sojka, summer research, Summer research 2015, Zach Vernon